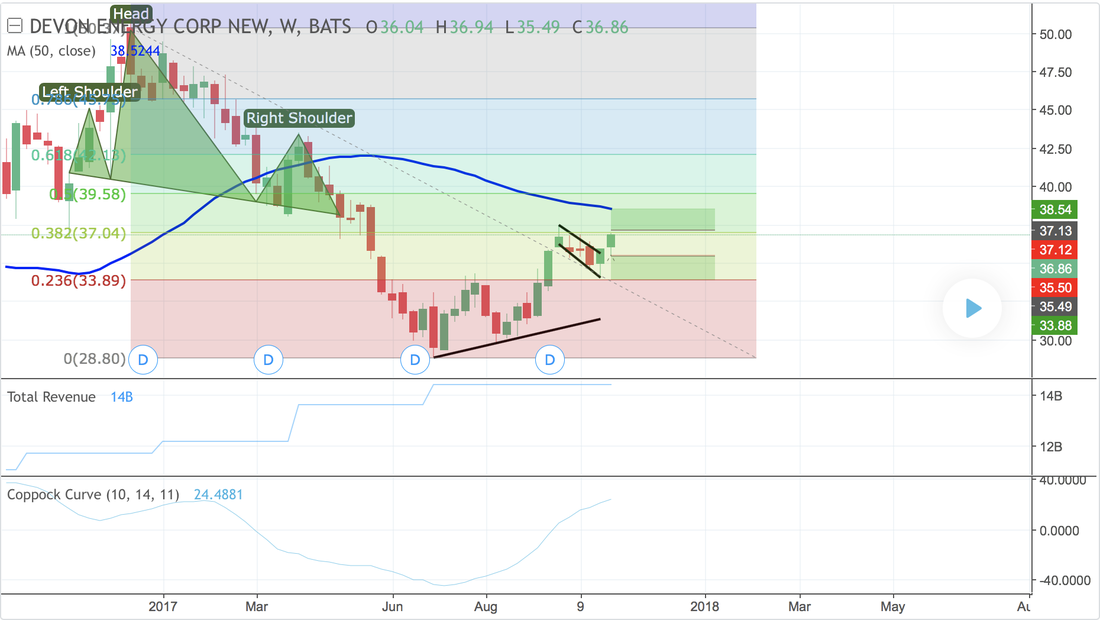
 DVN previously has produced head and shoulders patterns, hence the decrease in stock price for a long period. But, recently the stock broke out of its flag pattern and it is also earning report day for DVN today. So, there is an opportunity. I have put the Long order at the next Fibonacci level, as that will provide support and resistance. The Long take-profit is till the 50 MA. The Short order is until the next lower Fibonacci level.
0 Comments
30/10/2017 0 Comments Earnings report part iv (bp plc)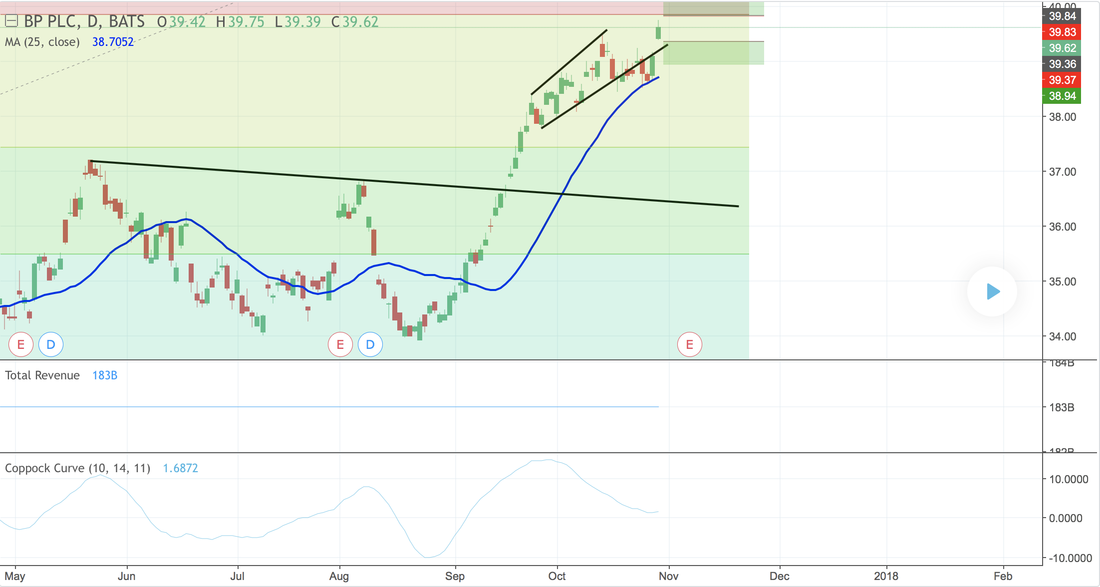 BP has broken out of a flag pattern. However, is going negative in the Coppock curve. Also, the total revenue has been the same for a while now. I'm going to be relying on volatility. If it's short it will be only short-term I believe and if it is Long then short-term increase followed by pull-back then increase until Q4. Also, the moving average is providing support. I put my Long on the next Fibonacci level.I have put the Long and short take profit at 1% but I think the price change will be much bigger so if it is - I will extend take profit.
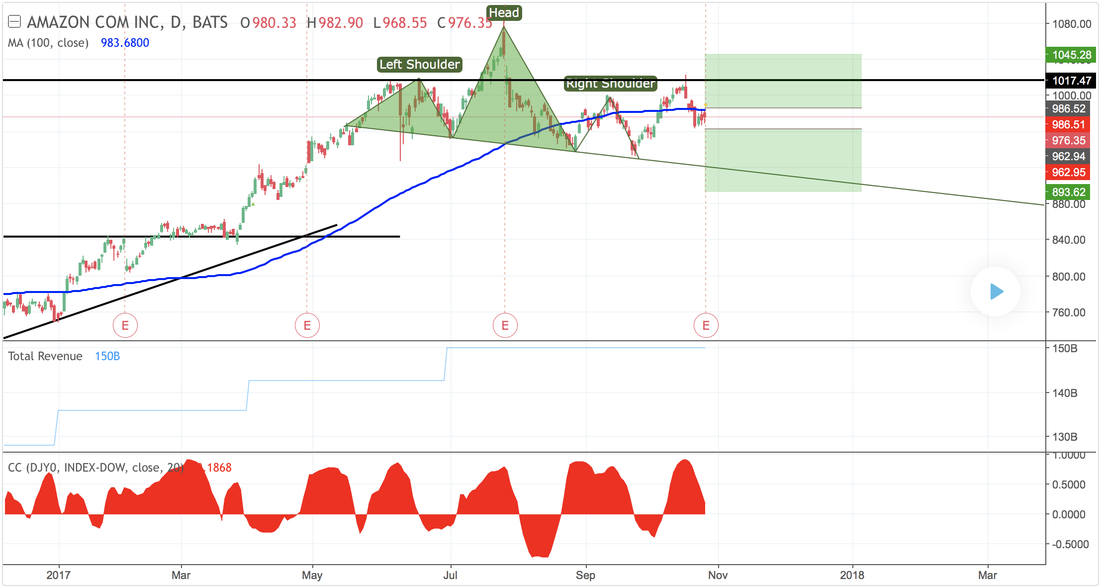 Amazon's total revenue has been increasing quarter on quarter since 2012, this is shown by the stock price rise from that point. But, the current trend is a head and shoulders pattern. The stock rose against the head and shoulders pattern which is only natural, could this mean a larger reversal is coming for the stock? I have chosen to hedge this earning report. But, AMZN doesn't really have that much volatility in times of earning reports - unless the surprise is astronomical. So, I'm going to be cutting short any losses. Also, the 100 MA is providing resistance as of this point, so this may be the volatile we are looking for, as stocks usually rise or fall quite a bit near moving averages. So, if the stock does boom, will it be enough to overpower the head and shoulders pattern?
24/10/2017 0 Comments Earnings report part ii (SFLY)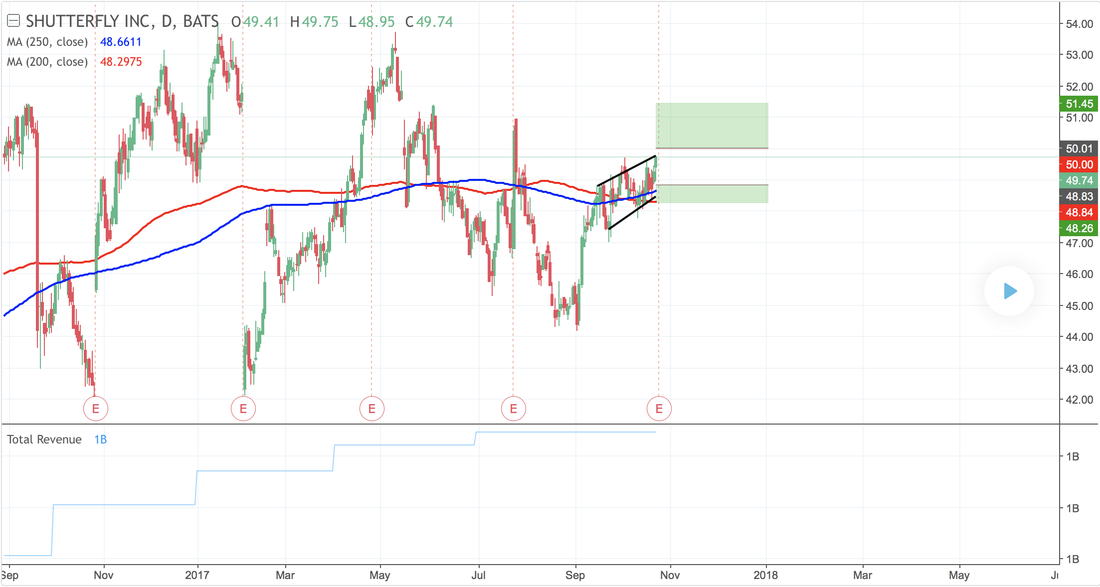 SFLY is currently in a flag pattern. The company's total revenue has been gradually increasing over past quarters impressively. Also, since the stock has such large volatility in past earning reports - I expect the same this time. To create an opportunity for some large returns, I have put a short order in for the previous trading days low, until the 200 MA. Also, a long market order for the price breaking 50.
16/10/2017 0 Comments Earnings Report part i (SONIC)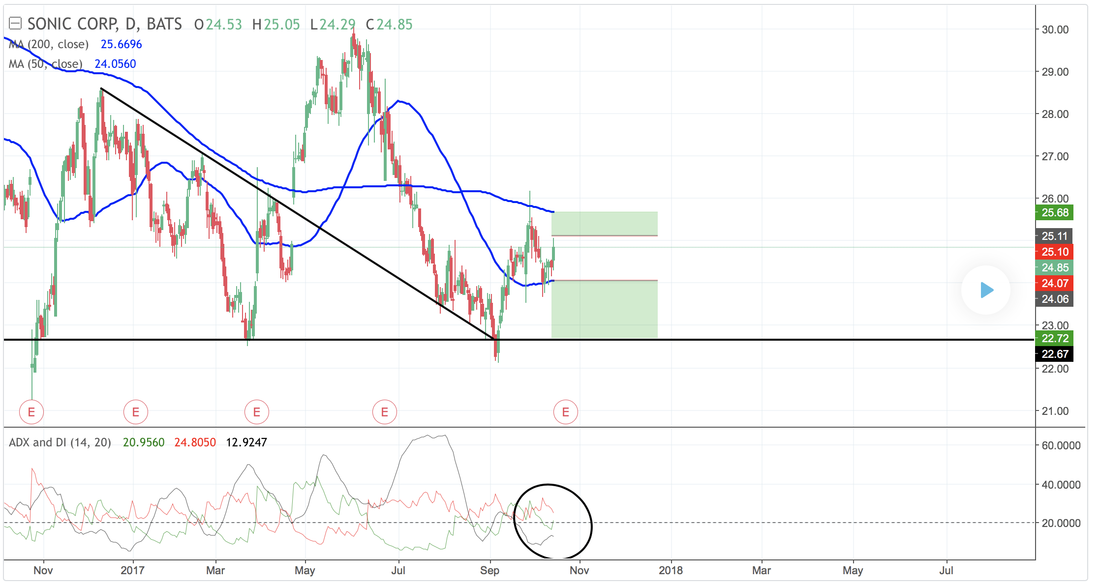 For this stock, the 200 MA is providing resistance and the 50 MA is providing support, so this stock will most likely stay in a horizontal pattern for a couple of weeks, and since the ADX green is about to cross the ADX red (eclipse on diagram). This stock will most likely be bullish if a flag pattern is forming. But since it is earning report today, an opportunity arises, in the past, this stock has shown very volatile in earning reports so I am going to give two orders to make the most of this opportunity, if the stock goes down I will sell, if it goes up I will buy.
If the stock breaks the moving averages I may choose to extend my holding of the stock. |
Search by typing & pressing enter
