|
20/4/2017 0 Comments Resistance rebound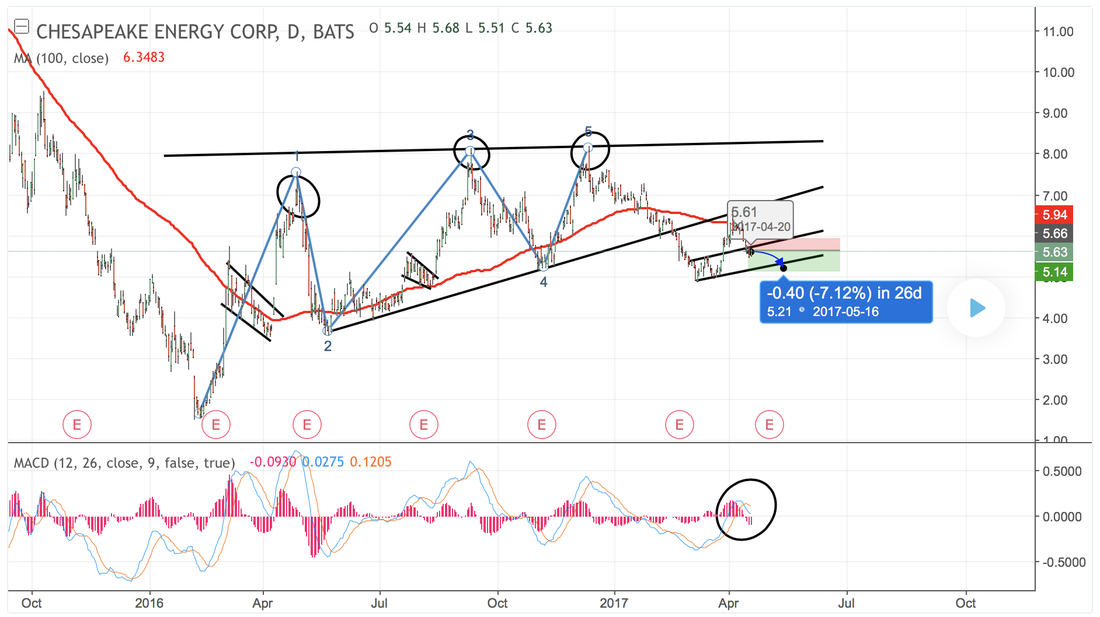 CHK has shown many patterns over the last year, with 3 flags and a double top pattern, and now the stock has broken out a flag pattern and has had a partial rise and has fallen to the support trendline but has had a breakout, this position will lead to the support trendline. Also, the 100 MA is providing resistance and that's where the stop is. This is also backed by the MACD divergence.
0 Comments
16/4/2017 0 Comments Flag PAttern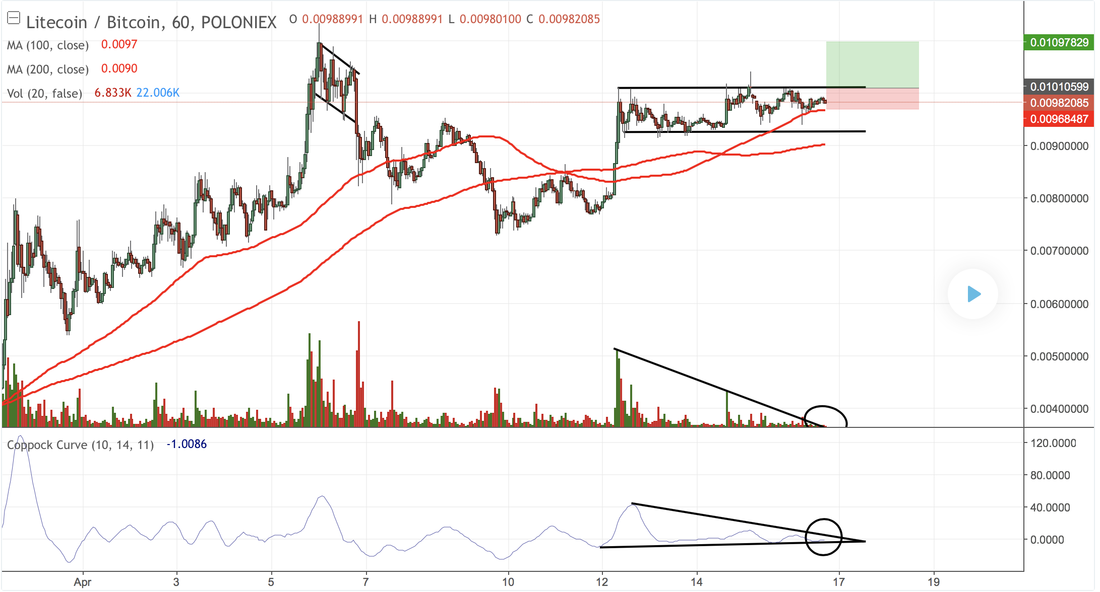 The asset has previously provided a flag pattern and now is in a flag pattern again. The 100 MA will provide support for the price, and the Coppock curve is in a triangle pattern and it will most likely breakout upwards to be positive. Also, this is backed by the volume decreasing showing a breakout is Imminent.
16/4/2017 0 Comments Short-term sell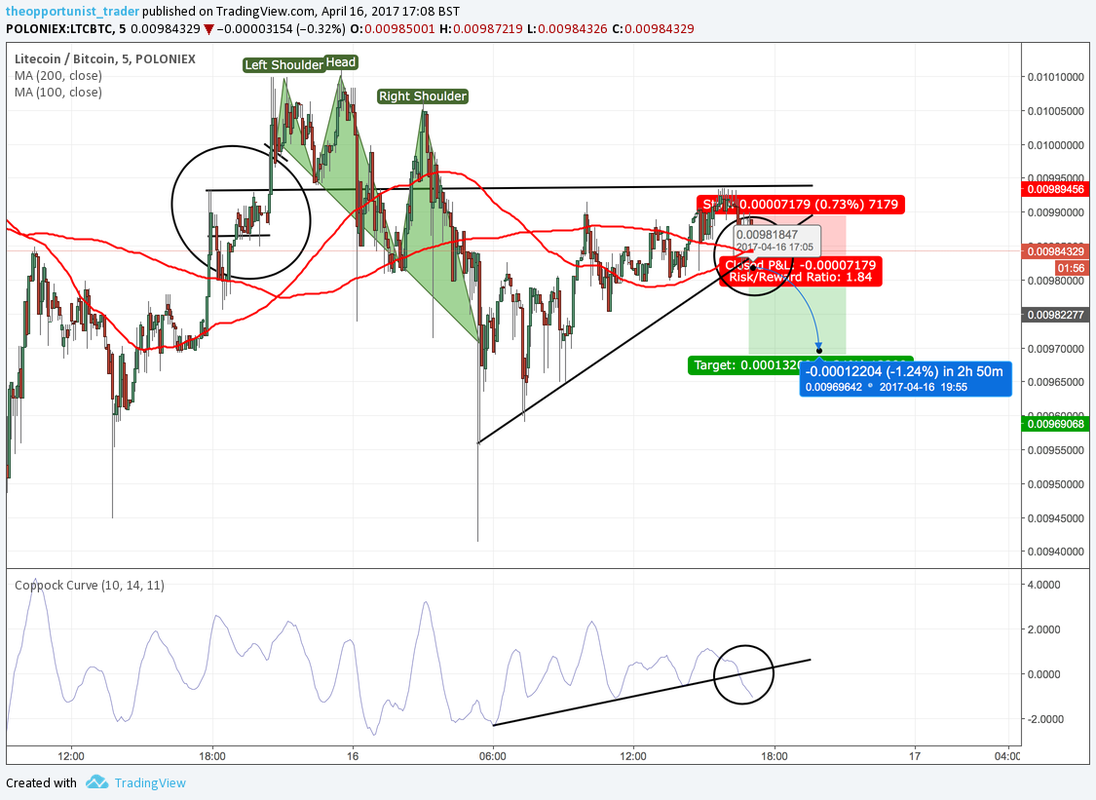 The asset has provided a head and shoulders pattern. Before that a flag pattern, so if it breaks the 100 MA then it's a definite sell until 0.097. This is also backed by the Coppock curve going negative and breaking upward trend and the moving averages crossing over, but this is a very short-term pattern.
15/4/2017 0 Comments Pound swing trade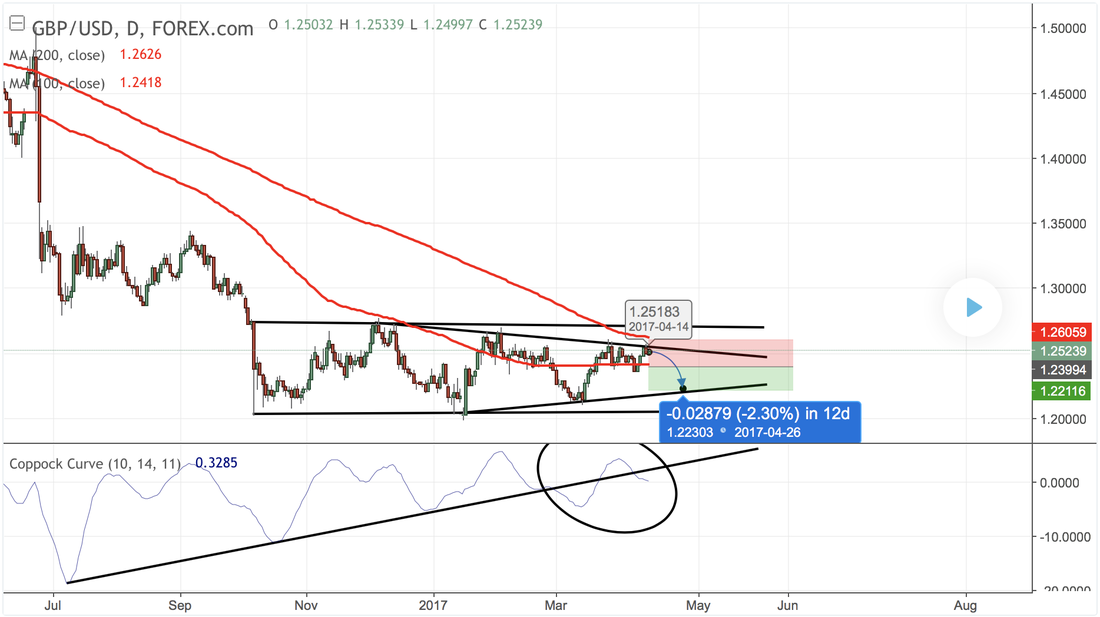 The pound seems to be in a very large flag pattern, but a mini triangle pattern, so this brings about the perfect swing trade, the 200 MA will provide resistance and so that's the stop-loss, but the short is when the Pound drops below the 100 MA till the lower support trendline.
13/4/2017 0 Comments Swing Trade?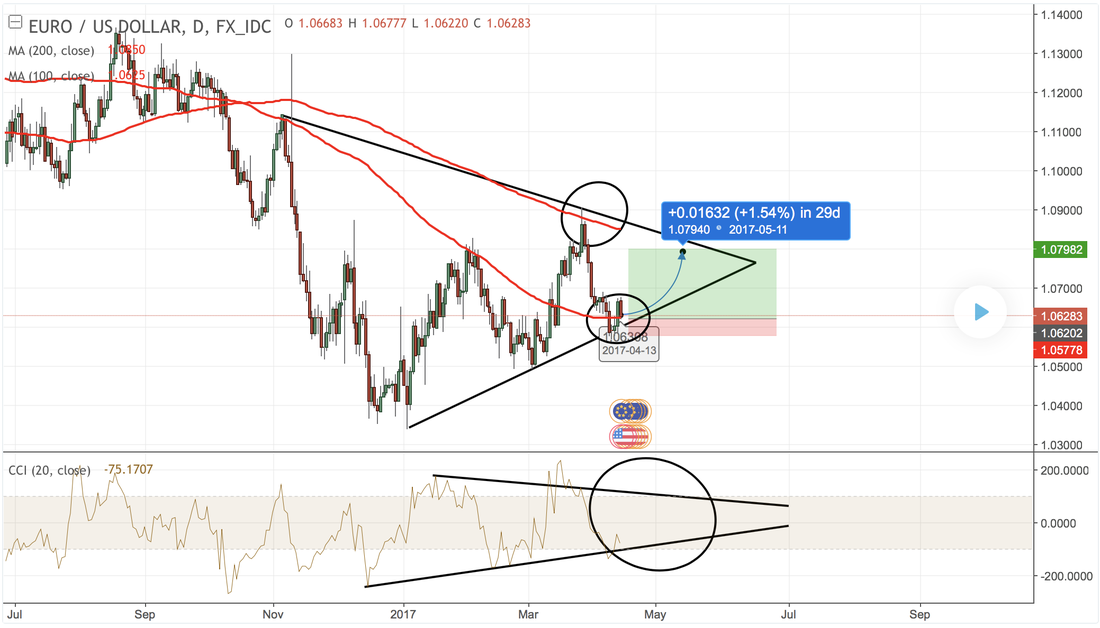 The EUR/USD will most likely increase in price to the 200 MA and the 100 MA will provide support, as shown in the past. Furthermore, the CCI seems to be in an ascending triangle pattern, so there could be a short-term increase in price coming up.
|
Search by typing & pressing enter
