|
25/1/2018 0 Comments earnings play pt.2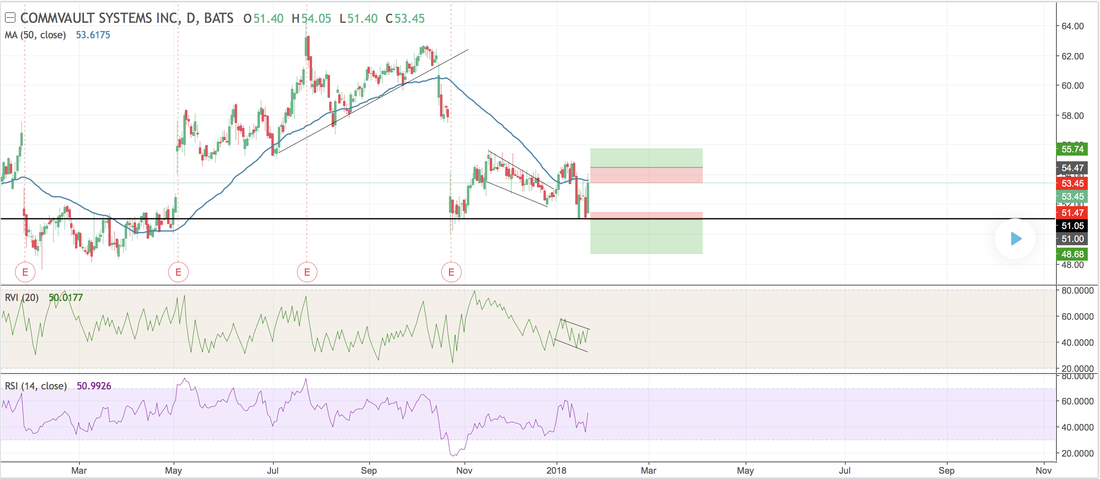 CVLT has recently broken out of a flag pattern and has decreased in price. However, the stock hit propr support and rose in price. The RVI is showing a flag pattern, so we could see a short-term rise in volatility. Also, the RSI has been rising for the last few days. So, I am putting my long position above the 50 MA which is providing resistance and potential support in the future. My short will be below the prior support.
0 Comments
19/1/2018 0 Comments Earnings play pt.1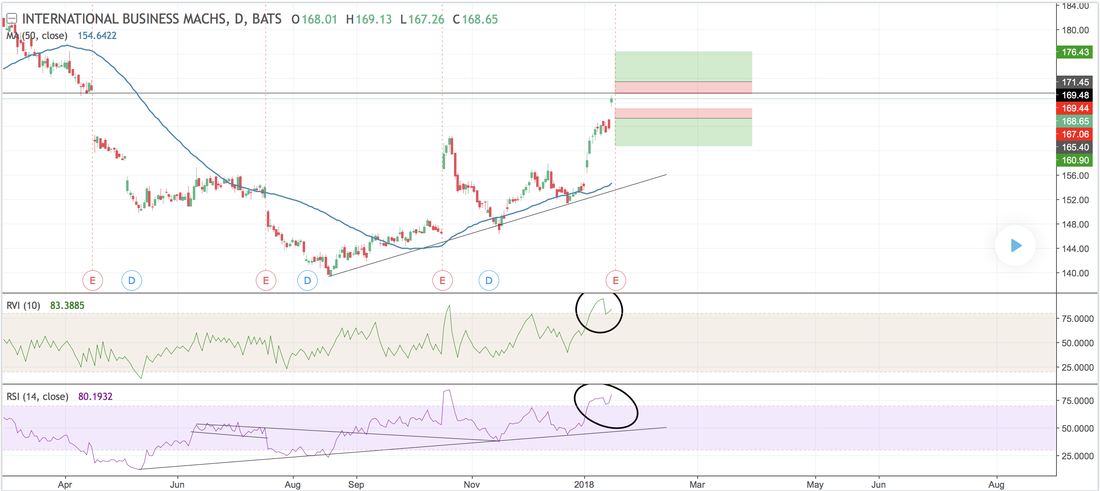 IBM has gapped up since yesterday's open. Looking at prior earning reports the stock does provide us with the volatility we need to profit off this earning. The RVI is backing this idea with the breakout in the trend. However, the RSI is showing this stock could potentially be overbought and a short-term sell-off could occur. Also, 50 MA is providing support for the stock. Potentially, a short and long hedge could be played here.
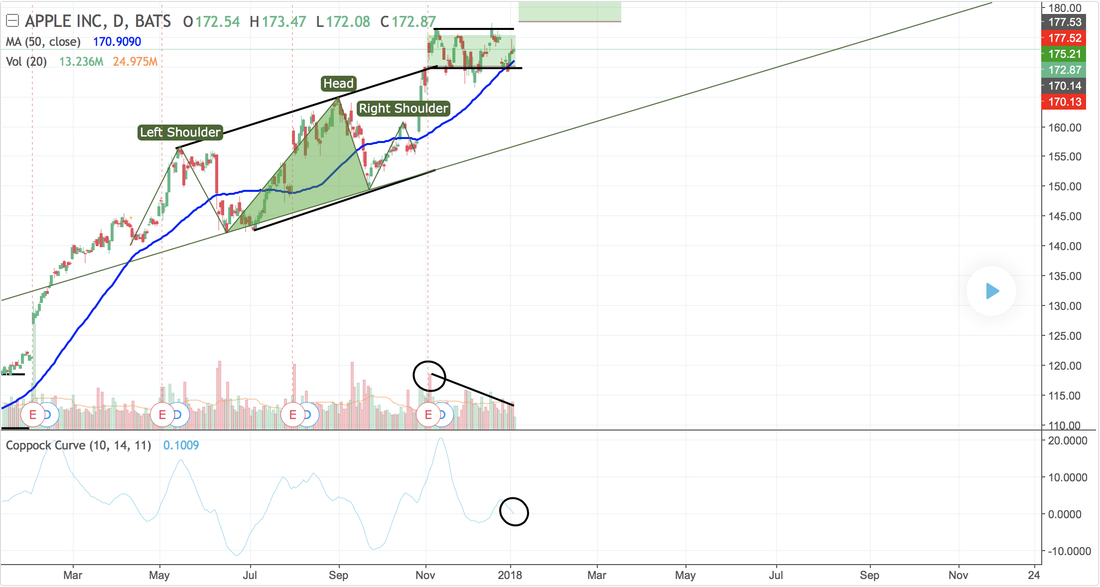 There have been many disputes over the first 1 Trillion-dollar company. Many say it is Google or Amazon - on the other hand, I say APPLE. The market capitalisation is calculated by (share price X shares outstanding). Currently, APPLE's shares outstanding is 5.09B, so for the company to get to 1 trillion dollars, the price would need to reach $196.50. That’s a 14.1% increase from current prices. AMZN requires a 107% increase to reach 1 trillion. GOOG requires a 167.90% increase. So APPLE is the closest. Also, APPLE is currently in a flag pattern. The RSI is in the middle so there’s a chance for a price rise to overbought. Also, the volume peaked at the start of the flag and has been gradually falling, this further enforces the flag pattern, in addition, the 50 MA is providing support to the stock at the bottom of the stock. The stock initially broken the flag pattern but then rebounded, this could be potentially showing a rapid rise in price in the future. However, the Coppock curve is going negative, so there may be a pullback before a rise.
|
Search by typing & pressing enter
